Listen to this article
AI visibility is becoming easier to report and harder to interpret.
One report shows that people are using AI platforms more often. Another shows growing AI Overview exposure. A prompt tracker reports more brand mentions or citations. Analytics shows little or no traffic from AI platforms.
These findings can look contradictory.
Usually, they are measuring different parts of the search journey.
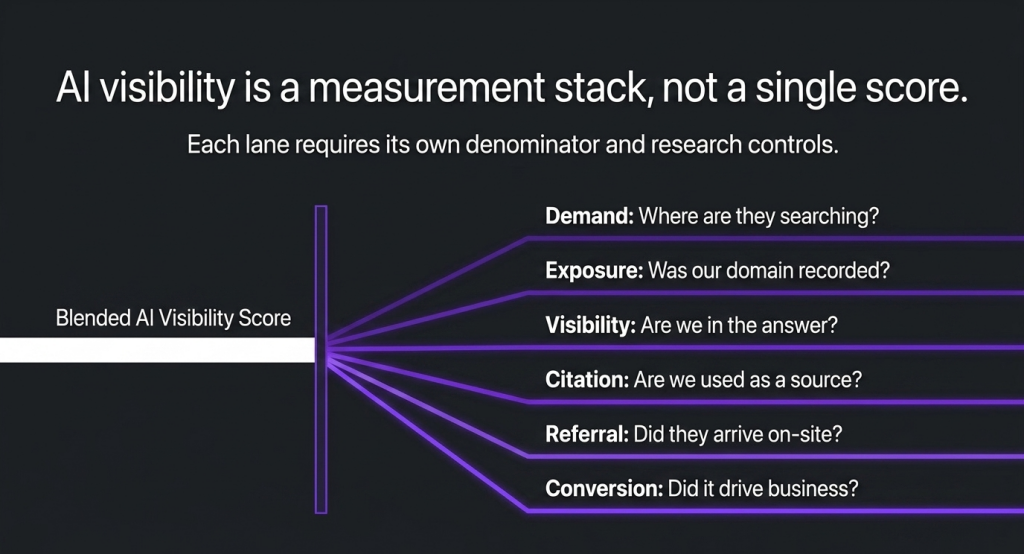
The problem starts when teams combine them into one broad number called AI visibility. That number may look useful, but it can hide important differences in:
- What was measured
- Who or what was included
- The denominator
- The platform and model
- The sampling method
- The business question being answered
A more reliable approach is to treat AI visibility as a set of separate evidence lanes.
Each lane should answer one specific question. Each should have its own denominator and research controls. The lanes can then be connected into a business story without pretending they are the same metric.
What you'll learn
- How to separate demand, exposure, answer visibility, citations, referrals and conversions.
- Why each lane needs its own denominator and research controls.
- How to interpret changes without turning correlation into causation.
- How to build a practical evidence-lane report for better decisions.
The six AI visibility evidence lanes
| Evidence lane | What it measures | Useful denominator | What it can support |
|---|---|---|---|
| Platform demand | Use of AI platforms or search surfaces | Visitors, sessions or users in the dataset | Audience and channel planning |
| Search exposure | Appearance of AI features such as AI Overviews | Eligible searches or impressions | Exposure monitoring |
| Answer visibility | Brand presence in AI answers | Tracked prompts or answers | Prompt and category visibility |
| Citations | Use of a page or domain as a source | Answers with citations, or all answers | Source and content diagnosis |
| Referrals | Visits arriving from AI platforms | AI-referred sessions or users | Landing-page and traffic analysis |
| Conversions | Leads, purchases or other business actions | Clearly defined conversion events | Commercial performance |
These lanes are related, but none can automatically substitute for another.
- More people using ChatGPT does not prove your brand appeared in ChatGPT.
- More AI Overview impressions do not prove more people clicked your website.
- More citations do not prove more recommendations.
- More AI referrals do not prove the cited page caused the visit.
- More conversions do not reveal the full influence of earlier AI exposure.
Do not use a metric to answer a question it was not designed to answer.
1. Platform demand is not brand visibility
Similarweb data discussed by Search Engine Journal suggests that AI platform use is growing while Google remains a much larger part of the search ecosystem. The analysis interprets AI search as being layered onto existing search behaviour rather than simply replacing it.
This is useful demand evidence. It can help answer:
Where are people spending time during discovery and research?
It cannot answer:
Did they see my brand?
That requires brand-level observation, such as a prompt panel or answer sample. A platform may have millions of users, but that does not tell you whether the users are searching for your category, whether your brand was included, or whether the brand was recommended.
Similarly, a chart that combines AI platform visits with AI Overview prevalence can provide useful market context, but it does not create a single causal dataset. Lily Ray notes that her AI Overview estimates came from sources separate from Similarweb.
The correct interpretation is:
AI usage and AI Overview exposure may both be growing, but they must remain separate evidence lanes.
2. Search exposure is not engagement
Search Console data can help show whether an AI feature is appearing for a set of searches.
That is exposure evidence. It tells you that a page or domain was recorded in an AI search context. It does not necessarily tell you whether the user noticed the result, opened the link, remembered the brand, or later converted.
Search Engine Journal's analysis of Google's generative AI reporting highlights how AI Overview and AI Mode impressions can create a misleading sense of performance when clicks, engagement and commercial value are not visible in the same metric.
This does not make impressions useless. It means they should be reported as exposure:
The site was recorded in more AI-search appearances.
That is different from saying that AI search generated more business. The second claim requires click, referral, conversion or other supporting evidence.
3. Answer visibility needs a defined prompt panel
Answer visibility is usually measured by running a set of prompts and recording whether the brand appears.
This lane is closer to what many teams mean by AI visibility, but it still requires careful definition.
A prompt-based visibility result should specify:
- Which prompts were used
- Which platform and model produced the answer
- How many runs were completed
- Whether the answer mentioned the brand
- Where the brand appeared
- Whether the mention was positive, neutral, negative or caveated
- Whether the brand was recommended or merely listed
- Whether the answer included citations
The denominator might be brand-mentioned answers divided by total valid answers, or brand-mentioned answers divided by answers for a specific topic cluster. Those are not interchangeable.
A brand may have strong visibility in a narrow product category but weak visibility across a broad industry panel. Both results can be accurate if the panels are different.
This is why one blended AI visibility score often hides the actual problem. It may combine branded prompts, category prompts, local prompts and comparison prompts into one average, even though each prompt type represents a different buyer situation.
4. Citations measure source use, not recommendation
A citation means that an AI system used a page or domain as source material. It does not necessarily mean that the brand was recommended.
A page can be cited because it contains a definition, specification, statistic or background explanation while the final answer recommends another provider. A brand can also be mentioned without its website being cited.
For this reason, citation reporting should be separated from:
- Brand mentions
- Recommendation rate
- Sentiment
- Answer position
- Referral traffic
The Search Engine Journal AI visibility roundup highlights that citations and rankings can vary substantially between repeated runs, and that no universal sample threshold works across every platform and topic.
A useful citation report should show the number of prompts and runs, the platform and model, the observed range, which pages were cited, whether the citations were accurate, whether the brand was recommended, and whether the change repeated across the measurement window.
A small percentage movement is not automatically a meaningful strategic win.
5. Referrals measure post-answer behaviour
AI referrals answer a different question:
Did someone arrive at the website from an AI platform?
This is closer to measurable traffic value, but it still does not explain the complete journey. A user may see a brand in an answer, remember it, search for it later in Google, visit directly and convert without any AI referral being recorded.
The reverse can also happen. A user may click an AI answer but leave without taking action.
The Search Engine Journal analysis makes another useful distinction between cited pages and referral landing pages. A deep product or article page may be cited, while the resulting visitor lands on the homepage.
That means content and conversion teams may need different optimisation work:
- The cited page needs to be useful and source-worthy.
- The landing page needs to explain the offer and support the next action.
Citation performance and referral performance should not be judged by the same page-level KPI.
6. Conversions require their own attribution rules
Conversions are the closest lane to commercial value, but they are also the easiest to overclaim.
A conversion report needs clear definitions for:
- What counts as a conversion
- Whether the event is a lead, qualified lead, sale or key event
- Whether duplicate events are removed
- Whether assisted conversions are included
- Which attribution model is used
- What time window is being measured
- Whether branded and non-branded demand are separated
An AI-referred lead can support a direct AI referral claim. It cannot, by itself, prove that all AI visibility activity generated the lead.
Likewise, a rise in conversions alongside a rise in AI citations may be strategically encouraging, but it does not establish causation without a stronger comparison design.
Why personalisation and sampling controls matter
AI-search research can change based on logged-in state, location, account history, browser context, model version, search or retrieval mode, prompt wording, and time of day or measurement window.
The supplied Marie Haynes Community source describes personalisation and logged-in context as possible sources of variation in AI Overview research.
A screenshot is an observation, not automatically a market trend.
For important tests, record the research state and repeat the measurement. When practical, compare logged-in and logged-out sessions, use consistent locations, and keep the prompt panel stable.
AI visibility tracking is closer to polling than traditional rank tracking. Repeated runs, fixed sampling rules, platform-level panels and confidence ranges are more useful than one-off screenshots or precise-looking single scores.
Key diagnostic framework
Use this sequence before combining signals into a business conclusion.
1. Name the lane
State whether the evidence is demand, exposure, answer visibility, citation, referral or conversion data.
- Do not relabel exposure as engagement.
- Do not relabel source use as recommendation.
2. Define the denominator
Record what the metric is divided by and which observations were excluded.
- Keep panels and populations separate.
- Show valid sample counts.
3. Record controls
Capture platform, model, prompts, location, login state and measurement window.
- Repeat important tests.
- Keep the research state stable.
4. Limit the decision
Use each metric only for the action its evidence can support.
- Separate observation from interpretation.
- Investigate before claiming causation.
A worked example
Imagine a team reports the following:
- AI platform usage increased
- AI Overview impressions increased
- Brand mentions increased
- Website referrals stayed flat
- Leads increased slightly
A single AI visibility score cannot explain this pattern.
The evidence-lane model produces a more careful interpretation:
- Platform demand suggests the category may be receiving more AI-related attention.
- AI Overview exposure increased, but engagement is not yet established.
- Brand mentions increased in the tracked prompt panel.
- Flat referrals suggest that increased mentions did not translate directly into AI traffic.
- The lead increase may be related, unrelated or influenced through another channel.
The correct next action is not to declare success or failure. It is to inspect prompt-level answer quality, citation and recommendation changes, AI referral landing pages, branded search movement, conversion attribution, and measurement consistency before and after the change.
How to build an evidence-lane report
Before reporting AI visibility movement, complete five checks:
- Name the lane. Is this demand, exposure, answer visibility, citation, referral or conversion evidence?
- Define the denominator. What is the metric divided by, and what was excluded?
- Record the research controls. Include platform, model, prompt set, location, logged-in state and measurement window.
- Separate observation from interpretation. State what moved before explaining what it might mean.
- Limit the decision. Use the metric only for the action it can support.
A strong report might therefore say:
Citation share increased across the tracked category prompt panel over repeated runs, but referral and conversion impact cannot yet be inferred.
That sentence is less dramatic than “AI visibility improved”. It is also more useful.
AI visibility is not one score waiting to be discovered. It is a set of evidence lanes describing different moments in the search and decision journey.
The goal is not to eliminate uncertainty. The goal is to make uncertainty visible, define what each metric can support, and prevent one number from carrying more meaning than the evidence allows.
Lumina Visibility helps teams monitor AI-search visibility across prompts, platforms, mentions and citations, so changes can be investigated in context instead of being reduced to a single number.
Measure every evidence lane in context
Track prompts, mentions, citations, competitors and source changes separately so your AI visibility report supports the right business decision.
Map your AI visibilityReferences
- Search Engine Journal, AI Search Isn't Replacing Google, It's Layering On Top.
- Search Engine Journal, Google's Generative AI Search Console Data Is A Trap For Marketers.
- Search Engine Journal, What It Takes to Get Cited, and Stay Cited in AI Search.
- Marie Haynes Community, Personalization can contaminate AI Overview research.
- Marie Haynes Community, Similarweb publishes 2026 AI-search usage data.
- Lily Ray, LLM visits and AI Overview prevalence.