Listen to this article
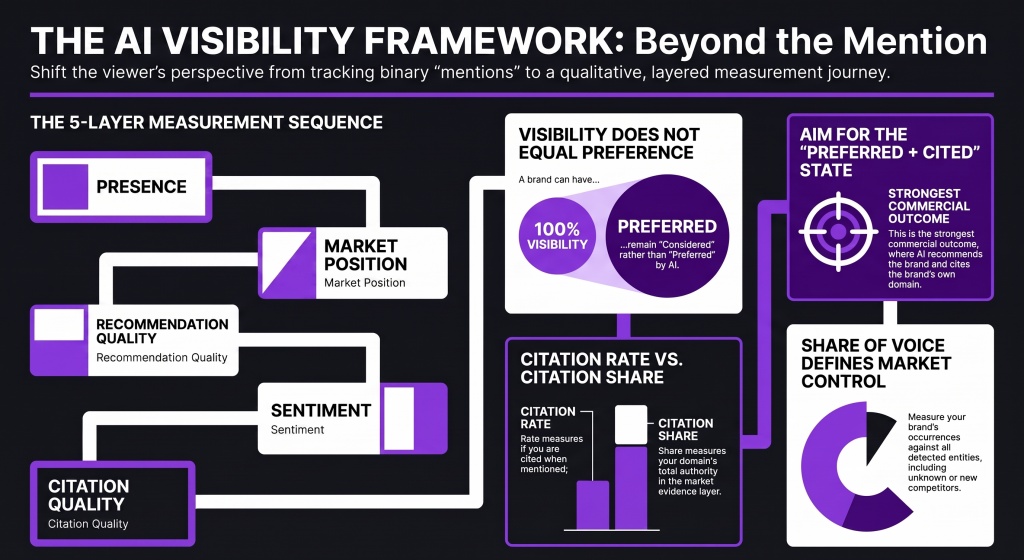
Brands should measure AI visibility across several layers: reach, market presence, answer quality, source quality and response outcomes.
Visibility shows whether the brand appears. Share of voice shows the brand’s share of all detected entity occurrences in the market conversation, including known competitors and unknown or newly discovered entities. Recommendation and sentiment reveal how the brand is positioned. Citation metrics show whether the brand’s own domain appears in the evidence layer and how often brand mentions are supported by citations. Response states combine these signals to show the quality of each individual AI-search outcome.
This matters because AI visibility is not a simple question of whether a brand was mentioned.
A brand can have high visibility but low recommendation. It can have a high citation rate but low citation share. It can have strong share of voice but negative sentiment. It can receive many citations, but still have weak influence over the AI answer. It can also show good overall averages while performing poorly on commercially important prompts.
Presence → market position → recommendation quality → sentiment → citation quality → commercial interpretation.
AI Visibility Measurement Should Go Beyond Mentions and Citations
Many brands start with a simple question:
“Did AI mention our brand?”
That is useful, but it is incomplete.
A mention only shows that the brand appeared in an AI-generated answer. It does not show whether the brand was preferred, whether competitors appeared more strongly, whether the answer was positive or negative, whether the mention was supported by evidence, or whether the mention happened in a commercially important context.
Citations are also useful, but they do not tell the full story on their own.
A citation can show that an AI answer connected the brand or claim to an identifiable source. But citation presence alone does not tell the brand whether the source was authoritative, whether the cited page supported the specific claim, whether the citation came from the brand’s own website, or whether the citation influenced the final recommendation.
This is why AI visibility measurement needs to move beyond a binary view.
The better question is not only:
“Was my brand mentioned?”
The better sequence is:
“Was my brand present, how much attention did it receive, was it preferred, how was it described, was the answer supported, and what type of outcome did the user actually see?”
What you'll learn
- Why AI visibility measurement must go beyond mentions and citations.
- How visibility, share of voice, recommendation, sentiment, citation metrics and response states answer different business questions.
- How to interpret a sample dashboard snapshot without treating it as a universal benchmark.
- How different teams should read AI visibility metrics.
- Why consistent measurement rules matter when AI answers vary.
AI Visibility Metrics Work Best as a Layered Measurement Model
A useful AI visibility framework should help brands answer five types of questions.
First, it should show whether the brand is present in relevant AI answers.
Second, it should show how much of the detected market conversation belongs to the brand across known competitors and unknown or newly discovered entities.
Third, it should show whether the brand is merely considered or actively recommended.
Fourth, it should show how the brand is described.
Fifth, it should show whether the answer is supported by citations and whether the configured brand domain represents a meaningful share of the evidence layer.
The measurement sequence looks like this:
Was the brand present?
↓
How much of the market conversation did it occupy?
↓
Was it preferred or merely considered?
↓
Was the description positive, neutral or negative?
↓
Was the answer supported by a citation?
↓
Did the brand’s sources represent a meaningful share of the evidence?
Each metric answers a different business question.
| Business question | Metric |
|---|---|
| Are we appearing at all? | Visibility |
| Are we competitive in the category? | Share of voice |
| Are we being presented as a choice? | Recommendation |
| How are we being described? | Sentiment |
| Are our mentions supported? | Citation presence / citation rate |
| Are our sources materially represented? | Citation share |
| Which outcomes need action first? | Response states |
Visibility Shows Whether the Brand Appears in Relevant AI Answers
Visibility measures the percentage of metric-eligible AI responses in which the brand is mentioned.
Visibility =
Responses mentioning the brand
÷
Metric-eligible responses
× 100
For example:
318 of 614 metric-eligible responses mentioned
= approximately 52% visibility
Visibility answers:
“When people ask relevant questions, how often does the AI system include our brand in the answer?”
This is the most direct measure of brand presence across the tracked prompt set.
A higher visibility rate generally means the brand has greater presence in AI-generated answers. However, visibility does not automatically mean the brand is recommended, described positively, cited, or positioned as the best option.
Visibility does not show whether the brand was preferred. It does not show whether competitors appeared more often. It does not show whether the mention was positive or negative. It does not show whether the brand was cited. It also does not show whether the brand appeared in an important commercial context.
Use visibility to identify where the brand is entering the relevant AI-search conversation, which topics or prompt groups produce presence, where the brand is absent, and whether visibility changes after content, authority or entity work.
The important interpretation is this:
A 52% visibility rate is not “52% market share.” It should not be presented as a probability that a user will purchase. It is a measured presence rate within a defined prompt set, date range, platform set and market. Unavailable checks are excluded from the denominator and should not be counted as absence.
Share of Voice Shows the Brand’s Share of Detected Market Occurrences
Share of voice measures the brand’s proportion of all detected entity occurrences across metric-eligible AI responses.
This includes known competitors and unknown or newly discovered entities. Repeated mentions in the same response count separately.
Share of voice =
Brand occurrences
÷
Total detected entity occurrences
× 100
For example:
1,236 of 3,707 detected entity occurrences
= approximately 33% share of voice
Share of voice answers:
“When AI discusses entities in this market, how much of the detected market conversation belongs to us?”
This is different from visibility.
Visibility usually looks at whether the brand appeared in a response. Share of voice looks at the brand’s occurrence share across all detected entities in the selected market conversation.
This helps the brand understand its competitive position inside AI-generated category discussions without limiting the analysis only to a predefined competitor list.
Two brands may both have 50% visibility, but one may receive more total occurrences across answers. That brand may have stronger share of voice even if both brands appear in the same percentage of responses.
Share of voice helps reveal whether visibility is translating into measurable category presence, and whether other detected entities are taking more of the measured market conversation.
However, share of voice does not necessarily show whether the brand is the preferred recommendation. It does not show whether the attention is positive. It does not show whether the mentions occur on high-value prompts. It also does not show whether the brand domain is cited.
The denominator must be defined clearly. Teams should understand whether occurrences include brand mentions, competitor mentions, unknown or newly discovered entities, product or service references, multiple mentions within one response, all tracked prompts, or only prompts where entities appeared.
Citation Presence Shows Whether AI Answers Cite the Brand Domain
Citation presence measures the percentage of metric-eligible AI responses that contain at least one citation to the configured brand domain.
The brand does not need to be explicitly mentioned for the response to count toward citation presence. The metric is based on whether the AI response cites the configured brand domain.
Citation presence =
Responses with brand-domain URL
÷
Metric-eligible responses
× 100
For example:
247 of 614 metric-eligible responses cited the brand domain
= approximately 40% citation presence
Citation presence answers:
“In how many usable AI answers did the response cite our configured brand domain?”
This shows whether the brand domain appears in the evidence layer, not merely whether the brand is named.
A mention can be unsupported. A brand-domain citation indicates that the AI answer includes a visible source reference to the configured domain.
Citation presence should not be described as any brand-connected citation or supporting source context. A citation to a general third-party source is not automatically counted as Citation Presence.
Citation presence alone does not tell the brand whether the cited page supports the specific claim made, how many citations appeared in each answer, or whether the cited source influenced the recommendation.
Recommendation Shows Whether AI Positions the Brand as a Choice
Recommendation measures how the AI system positions the brand in the answer.
In the dashboard example, recommendation is divided into three categories:
- Preferred
- Considered
- Avoided
For example:
Preferred: 103 responses / 32%
Considered: 215 responses / 68%
Avoided: 0 responses / 0%
In this screenshot, 32% Preferred and 68% Considered are the breakdown of the 318 mentioned responses with recommendation analysis. They are not the same as the overall Recommendation Presence Rate.
Recommendation Presence Rate =
Considered responses + Preferred responses
÷
Mentioned responses with recommendation analysis
× 100
Avoid Rate =
Avoid responses
÷
Mentioned responses with recommendation analysis
× 100
Because there are zero Avoid responses in the screenshot, positive recommendation presence is effectively 100% for that evaluated subset.
Recommendation answers:
“When AI names our brand, does it help the user choose us?”
This is often more commercially meaningful than visibility alone.
A brand may increase visibility while remaining “considered” rather than “preferred.” That means the presence problem has improved, but a differentiation, proof, positioning or trust problem may remain.
Preferred Recommendations Show Stronger Commercial Positioning
Preferred means the AI presents the brand as one of the best or most suitable options for the user’s needs.
This is the strongest commercial outcome because the brand is not simply visible. It is being actively positioned as a choice.
Typical signals may include language such as:
- Best for this use case.
- Strong option.
- Recommended choice.
- Particularly suitable for this audience.
- A leading provider for this need.
Considered Recommendations Show the Brand Is Present but Not Clearly Preferred
Considered means the AI includes the brand as a viable option but does not position it as the strongest choice.
This means the brand has entered the consideration set, but may still be losing preference to competitors or failing to communicate a clear reason to choose it.
Avoided Recommendations Show a Negative AI Search Outcome
Avoided means the AI explicitly discourages the user from choosing the brand or describes it as unsuitable, risky or inferior.
This is a negative commercial outcome and should be investigated even if overall visibility is high.
Recommendation should be analysed alongside visibility, sentiment, citation rate, prompt intent, competitor preference, and the reasons given for the recommendation.
Sentiment Shows How AI Describes the Brand When It Appears
Sentiment measures the emotional or evaluative tone associated with the brand in responses where the brand was mentioned.
The dashboard example displays a sentiment score of 0.55 and states that 266 of 318 responses were positive.
It is useful to distinguish between:
- Positive-response count: how many brand mentions were classified as positive.
- Sentiment score: the average of the individual sentiment scores for responses where the brand was mentioned.
For example:
266 of 318 brand mentions were positive
Sentiment score: 0.55
Sentiment score =
Sum of individual sentiment scores
÷
Responses where the brand was mentioned
The sentiment score ranges from -1 to +1, where 0 is neutral.
Sentiment answers:
“How is the AI describing our brand when it mentions us?”
It can reveal whether the brand is associated with strengths, weaknesses, trust, affordability, quality, reliability, risk, poor customer experience, specific use cases or limitations.
A brand that is frequently mentioned negatively may have strong visibility but weak brand health in AI search.
Sentiment can help teams identify reputational problems, incorrect or outdated descriptions, repeated objections, missing proof, competitor advantages, and content gaps around important attributes.
However, sentiment is not the same as customer satisfaction, Net Promoter Score, review sentiment, conversion rate, or human brand perception.
It is sentiment expressed in AI-generated answers under the tracked prompt set.
Sentiment should not be reduced to “positive is good, negative is bad.” A neutral or balanced answer may be appropriate for an informational prompt. Sentiment must be interpreted according to search intent.
Citation Rate Shows Whether Brand Mentions Are Supported by Sources
Citation rate measures the percentage of brand mentions that are accompanied by a citation.
Citation rate =
Brand mentions that were cited
÷
Total brand mentions
× 100
For example:
221 of 318 mentions cited
= approximately 69% citation rate
Citation rate answers:
“When AI mentions our brand, how often does it provide supporting evidence?”
This is a quality measure for the brand’s presence.
It helps distinguish between unsupported mentions and evidence-backed mentions.
High visibility with low citation rate may mean the brand is known but not strongly supported by retrievable sources.
High citation rate suggests that the brand is more often connected to sources when it appears. This can strengthen trust, verifiability, the user’s ability to investigate further, and the likelihood that the answer is grounded in available information.
However, citation rate does not show whether the citations are from high-quality sources, whether the brand owns the cited source, whether the citation supports the exact claim, how prominent the citation is, or whether competitors receive better citations.
A high citation rate can still be strategically weak if the citations come mainly from low-authority or irrelevant pages.
Citation Share Shows How Much of the AI Evidence Layer Points to the Brand Domain
Citation share measures the configured brand domain’s proportion of all citations captured across the selected scope.
Citation share =
Citations to the configured brand domain
÷
Total citations in the selected scope
× 100
For example:
688 of 5,828 total citations pointed to the brand domain
= approximately 12% citation share
Citation share answers:
“Of all the cited sources appearing in this selected AI-search scope, how much citation attention points to our configured brand domain?”
This is a competitive source-presence metric for the brand domain. Internally, this may also be referred to as Citation Authority.
Citation share should not imply that every profile, third-party page or associated source is automatically included. The dashboard metric counts citations to the configured brand domain divided by all citations in the selected scope.
The distinction between citation rate and citation share is important.
| Metric | Main question | Denominator |
|---|---|---|
| Citation rate | When we are mentioned, how often are we cited? | Brand mentions |
| Citation share | How much of the selected citation activity points to our brand domain? | All citations in the selected scope |
A brand can have high citation rate but low citation share. This means it is usually cited when mentioned, but the configured brand domain appears in a relatively small portion of citations across the selected scope.
A brand can have low citation rate but high citation share. This may mean it generates many brand-domain citations overall, but a large proportion of its mentions remain unsupported.
A brand can have high visibility and high citation share. This means the brand is both present and materially represented through its own domain in the source ecosystem.
A brand can also have high citation share but low recommendation. This means the brand domain is visible in citations, but the answer framing may not position the brand favourably.
Citation share should not be interpreted as a direct measure of website traffic, backlinks, authority or sales. It measures citation activity within the defined AI-search dataset.
Response States Show the Quality of Each Usable AI Search Outcome
Response states combine two questions for each usable AI response:
- How did AI position the brand?
- Was the brand’s own domain cited?
The current Lumina Visibility response-state model has seven mutually exclusive states:
- Preferred + cited
- Preferred + not cited
- Considered + cited
- Considered + not cited
- Avoid + cited
- Avoid + not cited
- Not mentioned
Unavailable checks, such as a prompt where a provider produced no usable answer, are excluded. They should not be classified as Not mentioned because there was no usable response to evaluate.
For example, the screenshot shows only five states because it contains zero Avoid responses:
Preferred + cited: 75
Preferred + not cited: 28
Considered + cited: 146
Considered + not cited: 69
Not mentioned: 296
These visible states total 614 metric-eligible responses.
Response states answer:
“What type of visibility outcome are we actually achieving in each usable answer?”
This is more actionable than one average score because it shows the relationship between presence, recommendation and brand-domain citation support.
Preferred + Cited Responses Show the Strongest AI Visibility Outcome
The brand is favoured and the configured brand domain is cited. These responses are useful examples of successful AI visibility because the brand is both commercially positioned and supported by its own cited domain.
Teams should investigate what prompts created this outcome, which pages were cited, what attributes the AI associated with the brand, and whether the pattern can be repeated across other prompts.
Preferred + Not Cited Responses Show Recommendation Without Brand-Domain Citation Support
The brand is favoured, but the response does not cite the configured brand domain.
This may indicate strong brand associations, but it also raises a source-support question.
Considered + Cited Responses Show Evidence Without Clear Preference
The brand is included as an option and the configured brand domain is cited, but the brand is not preferred.
This is an important diagnostic state. The brand may have source support but weak differentiation, unclear positioning or stronger competitors.
Considered + Not Cited Responses Show a Weaker Form of Presence
The brand is included as an option but is neither strongly preferred nor supported by a brand-domain citation. This may point to both a positioning gap and a source support gap.
Avoid + Cited Responses Show a Harmful Outcome With Brand-Domain Citation Support
The AI discourages choosing the brand and cites the configured brand domain.
This should be inspected carefully because the brand’s own domain may be part of an answer that creates a negative outcome.
Avoid + Not Cited Responses Show a Harmful Outcome Without Brand-Domain Citation Support
The AI discourages choosing the brand without citing the configured brand domain.
This should be reviewed with the raw response and any other cited sources to understand why the avoid classification appeared.
Not Mentioned Responses Show Where the Brand Is Absent
The brand did not appear in the usable response.
This is a reach or entity-association problem. Teams should investigate which prompts produce absence, whether the prompt reflects a priority buyer need, which entities are mentioned instead, what sources the AI relies on, and whether the brand has relevant, retrievable content for that question.
Response states matter because the same overall visibility rate can hide very different realities.
For example, 50% visibility mostly made up of “considered + not cited” is materially weaker than 50% visibility mostly made up of “preferred + cited.”
An increase in visibility may also be less valuable if it comes with a rise in avoided or unsupported mentions.
A decrease in total visibility may be acceptable if the remaining mentions become more preferred, positive and evidence-backed.
Lumina Visibility Metrics Help Brands Interpret AI Search Performance as a System
The following example should be read as a sample dashboard snapshot, not as a universal benchmark.
In this example, the brand was mentioned in 52% of metric-eligible responses, giving it meaningful reach across the tracked prompt set.
However, its 33% share of voice shows that the brand accounted for about one-third of detected entity occurrences in the selected market conversation.
The brand was preferred in 32% of the responses where it appeared and considered in 68%, suggesting that visibility was stronger than preference.
Its 69% citation rate indicates that most mentions were supported by a citation, while its 12% citation share shows that the configured brand domain represented a smaller portion of total citations in the selected scope.
The response-state breakdown provides the clearest diagnostic view:
Preferred + cited: 75
Preferred + not cited: 28
Considered + cited: 146
Considered + not cited: 69
Not mentioned: 296
In this case, 75 responses were both preferred and cited, while 146 were cited but only considered.
That distinction matters.
The brand is not simply trying to increase mentions. It needs to understand whether it is being recommended, whether those recommendations are supported, and where it is still being treated as only one option among many.
AI Visibility Patterns Help Diagnose Reach, Positioning and Source Problems
AI visibility metrics become more useful when they are interpreted as patterns.
The table below gives common diagnostic hypotheses.
| Pattern | Likely interpretation |
|---|---|
| Low visibility, low share of voice | The brand is not entering relevant AI answers |
| High visibility, low recommendation | The brand is known but not differentiated or preferred |
| High recommendation, low sentiment | The classification or prompt context needs investigation |
| High visibility, low citation rate | The brand is mentioned without enough supporting evidence |
| High citation rate, low citation share | The brand is well-supported when present but has limited overall source presence |
| High citation share, low recommendation | The brand’s sources are visible but the brand proposition may be weak |
| High positive sentiment, low visibility | The brand is well-described when present but lacks reach |
| Strong “preferred + cited”, high absence | Performance may be concentrated in specific prompt types |
| High “considered + cited”, low “preferred + cited” | Evidence exists, but differentiation or recommendation framing is weak |
These are diagnostic hypotheses, not automatic conclusions.
Teams should inspect the underlying responses and sources before deciding what to change.
A dashboard can show where the pattern exists. The raw AI responses and cited sources help explain why the pattern exists.
Different Teams Should Interpret AI Visibility Metrics Through Different Questions
Different stakeholders should not interpret the same AI visibility dashboard in the same way.
Executives Should Focus on Visibility, Competitiveness and Change Over Time
Executives should focus on visibility, share of voice, preferred recommendation, sentiment and change over time.
Their main question is:
“Are we becoming more visible and more competitive in AI-generated buying journeys?”
SEO and AEO Teams Should Focus on Sources, Citations and Prompt Segments
SEO and AEO teams should focus on citation rate, citation share, not-mentioned responses, cited sources, and prompt and topic segmentation.
Their main question is:
“Which entities, pages and sources are helping AI systems describe and recommend us?”
Content Teams Should Focus on Missing Proof and Weak Recommendation Signals
Content teams should focus on considered versus preferred, positive versus negative sentiment, preferred + not cited, considered + cited, repeated claims and missing proof.
Their main question is:
“What information or proof is missing from our content ecosystem?”
Brand Teams Should Focus on Sentiment, Associations and Competitor Comparisons
Brand and communications teams should focus on sentiment, recommendation, share of voice, competitor comparisons, repeated descriptions and associations.
Their main question is:
“What does AI believe our brand stands for?”
Consistent Measurement Rules Make AI Visibility Metrics More Meaningful
AI visibility is not a fixed ranking.
It is a probabilistic and context-dependent measurement of how AI systems represent a brand across a defined set of questions.
That means the measurement system needs consistency.
Brands should use a stable set of priority prompts. They should separate branded and unbranded prompts. They should track different buyer intents. They should record the AI platform and model where possible.
Country, language and market should be tracked separately. Date ranges should be kept consistent. Competitors should be analysed using the same prompt set.
Brands should avoid treating one response as definitive. Repeated measurements are useful because AI answers can vary.
Dashboard summaries should also be analysed alongside raw responses. A metric can show that something changed, but the raw responses help explain what changed.
Informational prompts should be separated from commercial recommendation prompts. Teams should also define whether multiple mentions or citations in one response count once or multiple times.
The goal is not to create a false sense of certainty.
The goal is to build a consistent measurement model that helps teams understand how AI systems represent the brand across relevant prompts, platforms, topics and competitors.
AI Visibility Benchmarks Should Not Treat One Metric as Proof of Success
Brands should avoid treating one metric as proof of commercial success.
High visibility does not automatically mean high recommendation.
High citation rate does not automatically mean strong source authority.
High share of voice does not automatically mean positive brand perception.
Positive sentiment does not automatically mean broad reach.
A strong average can still hide poor performance on important prompts.
Benchmarks should be interpreted within the defined prompt set, date range, platform set and market. They should also be compared over time using consistent methodology.
The more useful benchmark is not simply whether one number is high or low.
The more useful benchmark is whether the brand is improving across the full sequence:
Presence
→ market position
→ recommendation quality
→ sentiment
→ citation quality
→ commercial interpretation
Lumina Visibility Helps Brands Measure the Quality of AI Visibility, Not Just Its Existence
AI visibility measurement should not stop at mentions and citations.
A brand needs to know whether it appears in relevant answers, how much of the market conversation it occupies, whether it is preferred, how it is described, whether the answer is supported, and whether its sources are materially represented.
That is the difference between measuring visibility as existence and measuring visibility as business performance.
A brand that is merely mentioned has presence.
A brand that is preferred, positively described, cited and competitively represented has a stronger AI visibility outcome.
The purpose of measurement is to understand that difference.
Measure the quality of your AI visibility
Want to know whether your brand is merely appearing in AI answers, or being preferred, supported and competitively represented? Request an AI visibility assessment.
Request an AI visibility assessment